
Page 35 - EniFor2016_Report_eng
P. 35
33
Eni for 2016 | Operating model
People’s
safety
Eni considers the safety of people its priority and this is why it implements all the actions needed to reduce
accident rates and eliminate fatalities. In 2016, the main actions involved:
Promoting the Allocating internal Promoting and Implementing the Promoting actions
identification, skills, taught spreading the Process Safety to improve
analysis and in the Safety safety culture Management emergency
reporting of Near Competence using initiatives System, related training and
Misses and Center in Gela, in such as Road audits and response.
26
Unsafe Conditions the different Italian Shows, “Use your performance
in order to reduce and overseas sites Head”, "Safety indicators.
the causes of and the start of Day” and the
accidents and the Safety Training "Inside Lesson
injuries. Center’s activities. Learned” project.
27
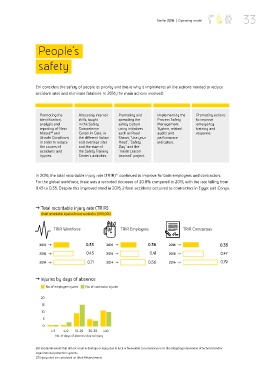
In 2016, the total recordable injury rate (TRIR) continued to improve for both employees and contractors.
For the global workforce, there was a recorded decrease of 20.8% compared to 2015, with the rate falling from
0.45 to 0.35. Despite this improved trend in 2016, 2 fatal accidents occurred to contractors in Egypt and Congo.
˛ Total recordable injury rate (TRIR)
(total recordable injuries/hours worked) x 1,000,000
TRIR Workforce TRIR Employees TRIR Contractors
2016 0.35 2016 0.36 2016 0.35
2015 0.45 2015 0.41 2015 0.47
2014 0.71 2014 0.56 2014 0.79
˛ Injuries by days of absence
No. of employee injuries No. of contractor injuries
20
15
10
5
0
1-3 4-9 10-29 30-39 >40
No. of days of absence due to injury
26) Incidental events that did not result in damage or injury due to luck or favourable circumstances or to the mitigating intervention of technical and/or
organizational protection systems.
27) Injury rates are calculated on Work Related events.