Page 30 - EniFor2016_Report_eng
P. 30

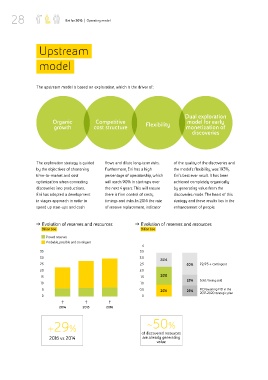
28                      Eni for 2016  |  Operating model


                  Upstream


                  model


                 The upstream model is based on exploration, which is the driver of:


                                                                                   Dual exploration
                        Organic            Competitive            Flexibility       model for early
                         growth            cost structure                           monetization of
                                                                                      discoveries


                 The exploration strategy is guided   flows and dilute long-term risks.   of the quality of the discoveries and
                 by the objectives of shortening   Furthermore, Eni has a high   the model’s flexibility, was 193%,
                 time-to-market and cost        percentage of operatorship, which   Eni’s best ever result. It has been
                 optimization when converting   will reach 90% in start-ups over   achieved completely organically
                 discoveries into productions.   the next 4 years. This will ensure   by generating value from the
                 Eni has adopted a development   there is firm control of costs,   discoveries made. The heart of this
                 in stages approach in order to   timings and risks. In 2016 the rate   strategy and these results lies in the
                 speed up start-ups and cash    of reserve replacement, indicator   enhancement of people.


                  ˛ Evolution of reserves and resources       ˛ Evolution of reserves and resources
                    Billion boe                                 Billion boe
                     Proved reserves
                      Probable, possible and contingent
                                                                4
                   35                                          3.5
                   30                                          3.0
                                                                        2016
                   25                                          2.5                  50%   P2/P3 + contingent
                   20                                          2.0
                   15                                          1.5      2015
                                                                                    25%   Sold / being sold
                   10                                          1.0
                    5                                          0.5      2014        25%   FID/awaiting FID in the
                                                                                          2017-2020 strategic plan
                    0                                           0
                           2014       2015      2016


                      +29%                                        ≈50%
                                                                of discovered resources
                       2016 vs 2014                             are already generating
                                                                       value
   25   26   27   28   29   30   31   32   33   34   35