
Page 32 - EniFor2016_Report_eng
P. 32
30 Eni for 2016 | Operating model
˛ Local Eni people in the upstream sector
14% 19% 65% Local
Expatriate
86% 81% 35%
Countries with historical Countries with an intermediate Recent entry Countries
presence presence
In overall terms, despite a slight of total employment overseas the line-by-line method ,
23
reduction in resources (-5%) has increased since 2015, local resources overseas have
recorded in 2016 compared with moving from 84.5% increased by 1,676 compared
the previous year, the percentage to 84.7%. For companies that with 2015, leaving the incidence
of local staff out are not consolidated with on total employment the same.
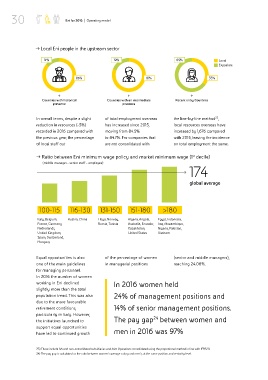
˛ Ratio between Eni minimum wage policy and market minimum wage (1 decile)
st
(middle manager - senior staff – employee)
174
global average
100-115 116-130 131-150 151-180 >180
Italy, Belgium, Austria, China Libya, Norway, Algeria, Angola, Egypt, Indonesia,
France, Germany, Russia, Tunisia Australia, Ecuador, Iraq, Mozambique,
Netherlands, Kazakhstan, Nigeria, Pakistan,
United Kingdom, United States Vietnam
Spain, Switzerland,
Hungary
Equal opportunities is also of the percentage of women (senior and middle managers),
one of the main guidelines in managerial positions reaching 24.06%.
for managing personnel.
In 2016 the number of women
working in Eni declined In 2016 women held
slightly more than the total
population trend. This was also 24% of management positions and
due to the more favourable
retirement conditions, 14% of senior management positions.
particularly in Italy. However, 24
the initiatives launched to The pay gap between women and
support equal opportunities
have led to continued growth men in 2016 was 97%
23) These include JVs and non-consolidated subsidiaries and Joint Operations consolidated using the proportional method in line with IFRS/11.
24) The pay gap is calculated as the ratio between women’s average salary and men’s, at the same position and seniority level.