
Page 16 - EniFor2016_Report_eng
P. 16
14 Eni for 2016 | Path to decarbonization
Physical Scenario Regulatory Technological Reputational
drivers drivers drivers drivers drivers
Extreme/ Uncertainty over Adoption of Speed of Stakeholders’
chronic weather the evolution of policies (such development focus on the issue
and climate the energy mix as carbon of low-carbon and increasing
phenomena with a and hydrocarbon pricing) aimed technological requests for
possible increase prices in a at sustaining solutions and transparency
in costs (including low-carbon the energy consequent by Institutions,
insurance) for context, with transition towards uncertainty the financial
adaptation effects on the low-carbon regarding the community, NGOs
measures to demand for fossil sources with effects on and public opinion.
protect assets fuels, on project effects on the business.
and people. operating costs price of CO . 2
and profitability.
Two assessment cycles were performed in 2016. They confirmed that climate change was among Eni’s top 20
risks that are monitored by the Board of Directors quarterly.
Comparing
scenarios
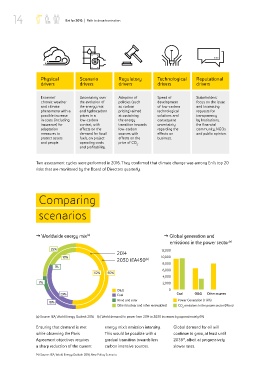
˛ Worldwide energy mix (a) ˛ Global generation and
emissions in the power sector (a)
25% 12,000
2014
18% 10,000
2030 IEA450 (b)
8,000
1%
6,000
52% 50%
4,000
7% 2,000
O&G 0
29% Coal Coal O&G Other sources
Wind and solar Power Generation (TWh)
18%
Other (nuclear and other renewables) CO emissions in the power sector (Mton)
2
(a) Source: IEA, World Energy Outlook 2016 (b) World demand for power from 2014 to 2030 increases by approximately 6%
Ensuring that demand is met energy mix’s emission intensity. Global demand for oil will
while observing the Paris This would be possible with a continue to grow, at least until
14
Agreement objectives requires gradual transition towards less 2035 , albeit at progressively
a sharp reduction of the current carbon intensive sources. slower rates.
14) Source: IEA, World Energy Outlook 2016, New Policy Scenario.